JVM性能调优监控工具jps、jstack、jmap、jhat、jstat、hprof使用详解 – 实例分析.
工具介绍部分:
现实企业级Java开发中,有时候我们会碰到下面这些问题:
- OutOfMemoryError,内存不足
- 内存泄露
- 线程死锁
- 锁争用(Lock Contention)
- Java进程消耗CPU过高
- ……
这些问题在日常开发中可能被很多人忽视(比如有的人遇到上面的问题只是重启服务器或者调大内存,而不会深究问题根源),但能够理解并解决这些问题是Java程序员进阶的必备要求。
A、 jps(Java Virtual Machine Process Status Tool)
jps主要用来输出JVM中运行的进程状态信息。语法格式如下:
- jps [options] [hostid]
如果不指定hostid就默认为当前主机或服务器。
命令行参数选项说明如下:
- -q 不输出类名、Jar名和传入main方法的参数
- -m 输出传入main方法的参数
- -l 输出main类或Jar的全限名
- -v 输出传入JVM的参数
比如下面:
- root@ubuntu:/# jps -m -l
- 2458 org.artifactory.standalone.main.Main /usr/local/artifactory-2.2.5/etc/jetty.xml
- 29920 com.sun.tools.hat.Main -port 9998 /tmp/dump.dat
- 3149 org.apache.catalina.startup.Bootstrap start
- 30972 sun.tools.jps.Jps -m -l
- 8247 org.apache.catalina.startup.Bootstrap start
- 25687 com.sun.tools.hat.Main -port 9999 dump.dat
- 21711 mrf-center.jar
B、 jstack
jstack主要用来查看某个Java进程内的线程堆栈信息。语法格式如下:
- jstack [option] pid
- jstack [option] executable core
- jstack [option] [server-id@]remote-hostname-or-ip
- 命令行参数选项说明如下:
- -l long listings,会打印出额外的锁信息,在发生死锁时可以用jstack -l pid来观察锁持有情况
- -m mixed mode,不仅会输出Java堆栈信息,还会输出C/C++堆栈信息(比如Native方法)
jstack可以定位到线程堆栈,根据堆栈信息我们可以定位到具体代码,所以它在JVM性能调优中使用得非常多。下面我们来一个实例找出某个Java进程中最耗费CPU的Java线程并定位堆栈信息,用到的命令有ps、top、printf、jstack、grep。
第一步先找出Java进程ID,服务器上的Java应用名称为mrf-center:
- root@ubuntu:/# ps -ef | grep mrf-center | grep -v grep
- root 21711 1 1 14:47 pts/3 00:02:10 java -jar mrf-center.jar
- 得到进程ID为21711,第二步找出该进程内最耗费CPU的线程,可以使用
- 1)ps -Lfp pid
- 2)ps -mp pid -o THREAD, tid, time
- 3)top -Hp pid
- 用第三个,输出如下:

TIME列就是各个Java线程耗费的CPU时间,CPU时间最长的是线程ID为21742的线程,用
- printf ”%x\n” 21742
得到21742的十六进制值为54ee,下面会用到。
OK,下一步终于轮到jstack上场了,它用来输出进程21711的堆栈信息,然后根据线程ID的十六进制值grep,如下:
- root@ubuntu:/# jstack 21711 | grep 54ee
- “PollIntervalRetrySchedulerThread” prio=10 tid=0x00007f950043e000 nid=0x54ee in Object.wait()
可以看到CPU消耗在PollIntervalRetrySchedulerThread这个类的Object.wait(),我找了下我的代码,定位到下面的代码:
- // Idle wait
- getLog().info(“Thread [" + getName() + "] is idle waiting…”);
- schedulerThreadState = PollTaskSchedulerThreadState.IdleWaiting;
- long now = System.currentTimeMillis();
- long waitTime = now + getIdleWaitTime();
- long timeUntilContinue = waitTime - now;
- synchronized(sigLock) {
- try {
- if(!halted.get()) {
- sigLock.wait(timeUntilContinue);
- }
- }
- catch (InterruptedException ignore) {
- }
- }
它是轮询任务的空闲等待代码,上面的sigLock.wait(timeUntilContinue)就对应了前面的Object.wait()。
C、 jmap(Memory Map)和jhat(Java Heap Analysis Tool)
jmap用来查看堆内存使用状况,一般结合jhat使用。
jmap语法格式如下:
- jmap [option] pid
- jmap [option] executable core
- jmap [option] [server-id@]remote-hostname-or-ip
如果运行在64位JVM上,可能需要指定-J-d64命令选项参数。
- jmap -permstat pid
打印进程的类加载器和类加载器加载的持久代对象信息,输出:类加载器名称、对象是否存活(不可靠)、对象地址、父类加载器、已加载的类大小等信息,如下图:

使用jmap -heap pid查看进程堆内存使用情况,包括使用的GC算法、堆配置参数和各代中堆内存使用情况。比如下面的例子
- root@ubuntu:/# jmap -heap 21711
- Attaching to process ID 21711, please wait…
- Debugger attached successfully.
- Server compiler detected.
- JVM version is 20.10-b01
- using thread-local object allocation.
- Parallel GC with 4 thread(s)
- Heap Configuration:
- MinHeapFreeRatio = 40
- MaxHeapFreeRatio = 70
- MaxHeapSize = 2067791872 (1972.0MB)
- NewSize = 1310720 (1.25MB)
- MaxNewSize = 17592186044415 MB
- OldSize = 5439488 (5.1875MB)
- NewRatio = 2
- SurvivorRatio = 8
- PermSize = 21757952 (20.75MB)
- MaxPermSize = 85983232 (82.0MB)
- Heap Usage:
- PS Young Generation
- Eden Space:
- capacity = 6422528 (6.125MB)
- used = 5445552 (5.1932830810546875MB)
- free = 976976 (0.9317169189453125MB)
- 84.78829520089286% used
- From Space:
- capacity = 131072 (0.125MB)
- used = 98304 (0.09375MB)
- free = 32768 (0.03125MB)
- 75.0% used
- To Space:
- capacity = 131072 (0.125MB)
- used = 0 (0.0MB)
- free = 131072 (0.125MB)
- 0.0% used
- PS Old Generation
- capacity = 35258368 (33.625MB)
- used = 4119544 (3.9287033081054688MB)
- free = 31138824 (29.69629669189453MB)
- 11.683876009235595% used
- PS Perm Generation
- capacity = 52428800 (50.0MB)
- used = 26075168 (24.867218017578125MB)
- free = 26353632 (25.132781982421875MB)
- 49.73443603515625% used
- ….
使用jmap -histo[:live] pid查看堆内存中的对象数目、大小统计直方图,如果带上live则只统计活对象,如下:
- root@ubuntu:/# jmap -histo:live 21711 | more
- num #instances #bytes class name
- ———————————————-
- 1: 38445 5597736 <constMethodKlass>
- 2: 38445 5237288 <methodKlass>
- 3: 3500 3749504 <constantPoolKlass>
- 4: 60858 3242600 <symbolKlass>
- 5: 3500 2715264 <instanceKlassKlass>
- 6: 2796 2131424 <constantPoolCacheKlass>
- 7: 5543 1317400 [I
- 8: 13714 1010768 [C
- 9: 4752 1003344 [B
- 10: 1225 639656 <methodDataKlass>
- 11: 14194 454208 java.lang.String
- 12: 3809 396136 java.lang.Class
- 13: 4979 311952 [S
- 14: 5598 287064 [[I
- 15: 3028 266464 java.lang.reflect.Method
- 16: 280 163520 <objArrayKlassKlass>
- 17: 4355 139360 java.util.HashMap$Entry
- 18: 1869 138568 [Ljava.util.HashMap$Entry;
- 19: 2443 97720 java.util.LinkedHashMap$Entry
- 20: 2072 82880 java.lang.ref.SoftReference
- 21: 1807 71528 [Ljava.lang.Object;
- 22: 2206 70592 java.lang.ref.WeakReference
- 23: 934 52304 java.util.LinkedHashMap
- 24: 871 48776 java.beans.MethodDescriptor
- 25: 1442 46144 java.util.concurrent.ConcurrentHashMap$HashEntry
- 26: 804 38592 java.util.HashMap
- 27: 948 37920 java.util.concurrent.ConcurrentHashMap$Segment
- 28: 1621 35696 [Ljava.lang.Class;
- 29: 1313 34880 [Ljava.lang.String;
- 30: 1396 33504 java.util.LinkedList$Entry
- 31: 462 33264 java.lang.reflect.Field
- 32: 1024 32768 java.util.Hashtable$Entry
- 33: 948 31440 [Ljava.util.concurrent.ConcurrentHashMap$HashEntry;
class name是对象类型,说明如下:
- B byte
- C char
- D double
- F float
- I int
- J long
- Z boolean
- [ 数组,如[I表示int[]
- [L+类名 其他对象
还有一个很常用的情况是:用jmap把进程内存使用情况dump到文件中,再用jhat分析查看。jmap进行dump命令格式如下:
- <strong>jmap -dump:format=b,file=dumpFileName pid</strong>
我一样地对上面进程ID为21711进行Dump:
- root@ubuntu:/# jmap -dump:format=b,file=/tmp/dump.dat 21711
- Dumping heap to /tmp/dump.dat ...
- Heap dump file created
dump出来的文件可以用MAT、VisualVM等工具查看,这里用jhat查看:
- root@ubuntu:/# jhat -port 9998 /tmp/dump.dat
- Reading from /tmp/dump.dat...
- Dump file created Tue Jan 28 17:46:14 CST 2014
- Snapshot read, resolving...
- Resolving 132207 objects...
- Chasing references, expect 26 dots..........................
- Eliminating duplicate references..........................
- Snapshot resolved.
- Started HTTP server on port 9998
- Server is ready.
注意如果Dump文件太大,可能需要加上-J-Xmx512m这种参数指定最大堆内存,即jhat -J-Xmx512m -port 9998 /tmp/dump.dat。然后就可以在浏览器中输入主机地址:9998查看了:
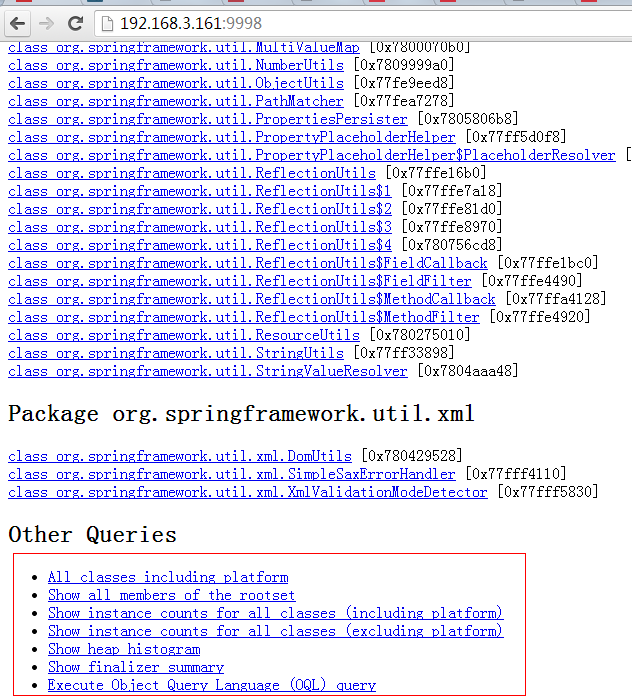
上面红线框出来的部分大家可以自己去摸索下,最后一项支持OQL(对象查询语言)。
D、jstat(JVM统计监测工具)
语法格式如下:
- jstat [ generalOption | outputOptions vmid [interval[s|ms] [count]] ]
vmid是Java虚拟机ID,在Linux/Unix系统上一般就是进程ID。interval是采样时间间隔。count是采样数目。比如下面输出的是GC信息,采样时间间隔为250ms,采样数为4:
- root@ubuntu:/# jstat -gc 21711 250 4
- S0C S1C S0U S1U EC EU OC OU PC PU YGC YGCT FGC FGCT GCT
- 192.0 192.0 64.0 0.0 6144.0 1854.9 32000.0 4111.6 55296.0 25472.7 702 0.431 3 0.218 0.649
- 192.0 192.0 64.0 0.0 6144.0 1972.2 32000.0 4111.6 55296.0 25472.7 702 0.431 3 0.218 0.649
- 192.0 192.0 64.0 0.0 6144.0 1972.2 32000.0 4111.6 55296.0 25472.7 702 0.431 3 0.218 0.649
- 192.0 192.0 64.0 0.0 6144.0 2109.7 32000.0 4111.6 55296.0 25472.7 702 0.431 3 0.218 0.649
要明白上面各列的意义,先看JVM堆内存布局:
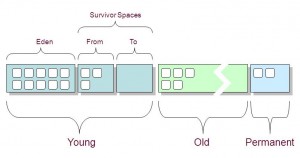
可以看出:
- 堆内存 = 年轻代 + 年老代 + 永久代
- 年轻代 = Eden区 + 两个Survivor区(From和To)
现在来解释各列含义:
- S0C、S1C、S0U、S1U:Survivor 0/1区容量(Capacity)和使用量(Used)
- EC、EU:Eden区容量和使用量
- OC、OU:年老代容量和使用量
- PC、PU:永久代容量和使用量
- YGC、YGT:年轻代GC次数和GC耗时
- FGC、FGCT:Full GC次数和Full GC耗时
- GCT:GC总耗时
E、hprof(Heap/CPU Profiling Tool)
hprof能够展现CPU使用率,统计堆内存使用情况。
语法格式如下:
- java -agentlib:hprof[=options] ToBeProfiledClass
- java -Xrunprof[:options] ToBeProfiledClass
- javac -J-agentlib:hprof[=options] ToBeProfiledClass
完整的命令选项如下:
- Option Name and Value Description Default
- ——————— ———– ——-
- heap=dump|sites|all heap profiling all
- cpu=samples|times|old CPU usage off
- monitor=y|n monitor contention n
- format=a|b text(txt) or binary output a
- file=<file> write data to file java.hprof[.txt]
- net=<host>:<port> send data over a socket off
- depth=<size> stack trace depth 4
- interval=<ms> sample interval in ms 10
- cutoff=<value> output cutoff point 0.0001
- lineno=y|n line number in traces? y
- thread=y|n thread in traces? n
- doe=y|n dump on exit? y
- msa=y|n Solaris micro state accounting n
- force=y|n force output to <file> y
- verbose=y|n print messages about dumps y
来几个官方指南上的实例。
CPU Usage Sampling Profiling(cpu=samples)的例子:
- CPU Usage Sampling Profiling(cpu=samples)的例子:
- java -agentlib:hprof=cpu=samples,interval=20,depth=3 Hello
- 上面每隔20毫秒采样CPU消耗信息,堆栈深度为3,生成的profile文件名称是java.hprof.txt,在当前目录。
- CPU Usage Times Profiling(cpu=times)的例子,它相对于CPU Usage Sampling Profile能够获得更加细粒度的CPU消耗信息,能够细到每个方法调用的开始和结束,它的实现使用了字节码注入技术(BCI):
- javac -J-agentlib:hprof=cpu=times Hello.java
- Heap Allocation Profiling(heap=sites)的例子:
- javac -J-agentlib:hprof=heap=sites Hello.java
- Heap Dump(heap=dump)的例子,它比上面的Heap Allocation Profiling能生成更详细的Heap Dump信息:
- javac -J-agentlib:hprof=heap=dump Hello.java
- 虽然在JVM启动参数中加入-Xrunprof:heap=sites参数可以生成CPU/Heap Profile文件,但对JVM性能影响非常大,不建议在线上服务器环境使用。
第二部分: 实例部分:
1、使用jstack来分析死锁问题:
上面说明中提到jstack 是一个可以返回在应用程序上运行的各种各样线程的一个完整转储的实用程序,您可以使用它查明问题。jstack [-l] <pid>,jpid可以通过使用jps命令来查看当前Java程序的jpid值,-l是可选参数,它可以显示线程阻塞/死锁情况
- /**
- * Dead lock example
- *
- * @author Josh Wang(Sheng)
- *
- * @email josh_wang23@hotmail.com
- */
- public class DeadLock2Live {
- public static void main(String[] args) {
- System.out.println(“ start the example —– ”);
- final Object obj_1 = new Object(), obj_2 = new Object();
- Thread t1 = new Thread(“t1″){
- @Override
- public void run() {
- synchronized (obj_1) {
- try {
- Thread.sleep(3000);
- } catch (InterruptedException e) {}
- synchronized (obj_2) {
- System.out.println(“thread t1 done.”);
- }
- }
- }
- };
- Thread t2 = new Thread(“t2″){
- @Override
- public void run() {
- synchronized (obj_2) {
- try {
- Thread.sleep(3000);
- } catch (InterruptedException e) {}
- synchronized (obj_1) {
- System.out.println(“thread t2 done.”);
- }
- }
- }
- };
- t1.start();
- t2.start();
- }
- }
以上DeadLock类是一个死锁的例子,假使在我们不知情的情况下,运行DeadLock后,发现等了N久都没有在屏幕打印线程完成信息。这个时候我们就可以使用jps查看该程序的jpid值和使用jstack来生产堆栈结果问题。
- java -cp deadlock.jar DeadLock &
- $ jps
- 3076 Jps
- 448 DeadLock
- $ jstack -l 448 > deadlock.jstack
结果文件deadlock.jstack内容如下:
- 2014-11-29 13:31:06
- Full thread dump Java HotSpot(TM) 64-Bit Server VM (24.65-b04 mixed mode):
- “Attach Listener” daemon prio=5 tid=0x00007fd9d4002800 nid=0x440b waiting on condition [0x0000000000000000]
- java.lang.Thread.State: RUNNABLE
- Locked ownable synchronizers:
- - None
- “DestroyJavaVM” prio=5 tid=0x00007fd9d4802000 nid=0×1903 waiting on condition [0x0000000000000000]
- java.lang.Thread.State: RUNNABLE
- Locked ownable synchronizers:
- - None
- “t2″ prio=5 tid=0x00007fd9d30ac000 nid=0×5903 waiting for monitor entry [0x000000011da46000]
- java.lang.Thread.State: BLOCKED (on object monitor)
- at DeadLock$2.run(DeadLock.java:38)
- - waiting to lock <0x00000007aaba7e58> (a java.lang.Object)
- - locked <0x00000007aaba7e68> (a java.lang.Object)
- Locked ownable synchronizers:
- - None
- “t1″ prio=5 tid=0x00007fd9d30ab800 nid=0×5703 waiting for monitor entry [0x000000011d943000]
- java.lang.Thread.State: BLOCKED (on object monitor)
- at DeadLock$1.run(DeadLock.java:23)
- - waiting to lock <0x00000007aaba7e68> (a java.lang.Object)
- - locked <0x00000007aaba7e58> (a java.lang.Object)
- Locked ownable synchronizers:
- - None
- “Service Thread” daemon prio=5 tid=0x00007fd9d2809000 nid=0×5303 runnable [0x0000000000000000]
- java.lang.Thread.State: RUNNABLE
- Locked ownable synchronizers:
- - None
- “C2 CompilerThread1″ daemon prio=5 tid=0x00007fd9d304e000 nid=0×5103 waiting on condition [0x0000000000000000]
- java.lang.Thread.State: RUNNABLE
- Locked ownable synchronizers:
- - None
- “C2 CompilerThread0″ daemon prio=5 tid=0x00007fd9d2800800 nid=0x4f03 waiting on condition [0x0000000000000000]
- java.lang.Thread.State: RUNNABLE
- Locked ownable synchronizers:
- - None
- “Signal Dispatcher” daemon prio=5 tid=0x00007fd9d3035000 nid=0x4d03 runnable [0x0000000000000000]
- java.lang.Thread.State: RUNNABLE
- Locked ownable synchronizers:
- - None
- “Finalizer” daemon prio=5 tid=0x00007fd9d2013000 nid=0×3903 in Object.wait() [0x000000011d18d000]
- java.lang.Thread.State: WAITING (on object monitor)
- at java.lang.Object.wait(Native Method)
- - waiting on <0x00000007aaa85608> (a java.lang.ref.ReferenceQueue$Lock)
- at java.lang.ref.ReferenceQueue.remove(ReferenceQueue.java:135)
- - locked <0x00000007aaa85608> (a java.lang.ref.ReferenceQueue$Lock)
- at java.lang.ref.ReferenceQueue.remove(ReferenceQueue.java:151)
- at java.lang.ref.Finalizer$FinalizerThread.run(Finalizer.java:209)
- Locked ownable synchronizers:
- - None
- “Reference Handler” daemon prio=5 tid=0x00007fd9d2012000 nid=0×3703 in Object.wait() [0x000000011d08a000]
- java.lang.Thread.State: WAITING (on object monitor)
- at java.lang.Object.wait(Native Method)
- - waiting on <0x00000007aaa85190> (a java.lang.ref.Reference$Lock)
- at java.lang.Object.wait(Object.java:503)
- at java.lang.ref.Reference$ReferenceHandler.run(Reference.java:133)
- - locked <0x00000007aaa85190> (a java.lang.ref.Reference$Lock)
- Locked ownable synchronizers:
- - None
- “VM Thread” prio=5 tid=0x00007fd9d5011000 nid=0×3503 runnable
- “GC task thread#0 (ParallelGC)” prio=5 tid=0x00007fd9d200b000 nid=0×2503 runnable
- “GC task thread#1 (ParallelGC)” prio=5 tid=0x00007fd9d200b800 nid=0×2703 runnable
- “GC task thread#2 (ParallelGC)” prio=5 tid=0x00007fd9d200c800 nid=0×2903 runnable
- “GC task thread#3 (ParallelGC)” prio=5 tid=0x00007fd9d200d000 nid=0x2b03 runnable
- “GC task thread#4 (ParallelGC)” prio=5 tid=0x00007fd9d200d800 nid=0x2d03 runnable
- “GC task thread#5 (ParallelGC)” prio=5 tid=0x00007fd9d200e000 nid=0x2f03 runnable
- “GC task thread#6 (ParallelGC)” prio=5 tid=0x00007fd9d200f000 nid=0×3103 runnable
- “GC task thread#7 (ParallelGC)” prio=5 tid=0x00007fd9d200f800 nid=0×3303 runnable
- “VM Periodic Task Thread” prio=5 tid=0x00007fd9d3033800 nid=0×5503 waiting on condition
- JNI global references: 114
- Found one Java-level deadlock:
- =============================
- <span style=”color: #ff0000;”><strong>”t2″:
- waiting to lock monitor 0x00007fd9d30aebb8 (object 0x00000007aaba7e58, a java.lang.Object),
- which is held by ”t1″
- “t1″:
- waiting to lock monitor 0x00007fd9d28128b8 (object 0x00000007aaba7e68, a java.lang.Object),
- which is held by ”t2″
- Java stack information for the threads listed above:</strong></span>
- ===================================================
- <span style=”color: #ff0000;”>”t2″:
- at DeadLock$2.run(DeadLock.java:38)
- - waiting to lock <0x00000007aaba7e58> (a java.lang.Object)
- - locked <0x00000007aaba7e68> (a java.lang.Object)
- “t1″:
- at DeadLock$1.run(DeadLock.java:23)
- - waiting to lock <0x00000007aaba7e68> (a java.lang.Object)
- - locked <0x00000007aaba7e58> (a java.lang.Object)
- Found 1 deadlock.
- </span>
从这个结果文件我们一看到发现了一个死锁,具体是线程t2在等待线程t1,而线程t1在等待线程t2造成的,同时也记录了线程的堆栈和代码行数,通过这个堆栈和行数我们就可以去检查对应的代码块,从而发现问题和解决问题。
可通过下面的代码解决死锁问题:
- import java.util.concurrent.locks.Lock;
- import java.util.concurrent.locks.ReentrantLock;
- /**
- * Dead lock example
- *
- * @author Josh Wang(Sheng)
- *
- * @email josh_wang23@hotmail.com
- */
- public class DeadLock2Live {
- public static void main(String[] args) {
- System.out.println(“ start the example —– ”);
- final Lock lock = new ReentrantLock();
- Thread t1 = new Thread(“t1″) {
- @Override
- public void run() {
- try {
- lock.lock();
- Thread.sleep(3000);
- System.out.println(“thread t1 done.”);
- } catch (InterruptedException e) {
- e.printStackTrace();
- } finally {
- lock.unlock();
- }
- }
- };
- Thread t2 = new Thread(“t2″) {
- @Override
- public void run() {
- try {
- lock.lock();
- Thread.sleep(3000);
- System.out.println(“thread t2 done.”);
- } catch (InterruptedException e) {
- e.printStackTrace();
- } finally {
- lock.unlock();
- }
- }
- };
- t1.start();
- t2.start();
- }
- }
2、继续使用jstack来分析HashMap在多线程情况下的死锁问题:
对于如下代码,使用10个线程来处理提交的2000个任务,每个任务会分别循环往hashmap中分别存入和取出1000个数,通过测试发现,程序并不能完整执行完成。[PS:该程序能不能成功执行完,有时也取决于所使用的服务器的运行状况,我在笔记本上测试的时候,大多时候该程序不能成功执行完成,后者会出现CPU转速加快,发热等情况]
- import java.util.HashMap;
- import java.util.Map;
- import java.util.concurrent.Callable;
- import java.util.concurrent.ExecutionException;
- import java.util.concurrent.ExecutorService;
- import java.util.concurrent.Executors;
- /**
- *
- */
- /**
- * @author Josh Wang(Sheng)
- *
- * @email josh_wang23@hotmail.com
- */
- public class HashMapDeadLock implements Callable<Integer> {
- private static ExecutorService threadPool = Executors.newFixedThreadPool(10);
- private static Map<Integer, Integer> results = new HashMap<>();
- @Override
- public Integer call() throws Exception {
- results.put(1, 1);
- results.put(2, 2);
- results.put(3, 3);
- for (int i = 0; i < 1000; i++) {
- results.put(i, i);
- }
- Thread.sleep(1000);
- for (int i= 0; i < 1000; i++) {
- results.remove(i);
- }
- System.out.println(“ —- ” + Thread.currentThread().getName() + ” ” + results.get(0));
- return results.get(1);
- }
- public static void main(String[] args) throws InterruptedException, ExecutionException {
- try {
- for (int i = 0; i < 2000; i++) {
- HashMapDeadLock hashMapDeadLock = new HashMapDeadLock();
- // Future<Integer> future = threadPool.submit(hashMapDeadLock);
- // future.get();
- threadPool.submit(hashMapDeadLock);
- }
- } catch (Exception e) {
- e.printStackTrace();
- } finally {
- threadPool.shutdown();
- }
- }
- }
1) 使用jps查看线程可得:
- 43221 Jps
- 30056
- 43125 HashMapDeadLock
2)使用jstack导出多线程栈区信息:
- jstack -l 43125 > hash.jstack
3) hash.jstack的内容如下:
- 2014-11-29 18:14:22
- Full thread dump Java HotSpot(TM) 64-Bit Server VM (24.65-b04 mixed mode):
- “Attach Listener” daemon prio=5 tid=0x00007f83ee08a000 nid=0x5d07 waiting on condition [0x0000000000000000]
- java.lang.Thread.State: RUNNABLE
- Locked ownable synchronizers:
- - None
- “DestroyJavaVM” prio=5 tid=0x00007f83eb016800 nid=0×1903 waiting on condition [0x0000000000000000]
- java.lang.Thread.State: RUNNABLE
- Locked ownable synchronizers:
- - None
- “pool-1-thread-10″ prio=5 tid=0x00007f83ec80a000 nid=0×6903 runnable [0x000000011cd19000]
- java.lang.Thread.State: RUNNABLE
- at java.util.HashMap.transfer(HashMap.java:601)
- at java.util.HashMap.resize(HashMap.java:581)
- at java.util.HashMap.addEntry(HashMap.java:879)
- at java.util.HashMap.put(HashMap.java:505)
- <strong><span style=”color: #ff0000;”>at HashMapDeadLock.call(HashMapDeadLock.java:30)
- at HashMapDeadLock.call(HashMapDeadLock.java:1)</span></strong>
- at java.util.concurrent.FutureTask.run(FutureTask.java:262)
- at java.util.concurrent.ThreadPoolExecutor.runWorker(ThreadPoolExecutor.java:1145)
- at java.util.concurrent.ThreadPoolExecutor$Worker.run(ThreadPoolExecutor.java:615)
- at java.lang.Thread.run(Thread.java:745)
- Locked ownable synchronizers:
- - <0x00000007aaba84c8> (a java.util.concurrent.ThreadPoolExecutor$Worker)
- “Service Thread” daemon prio=5 tid=0x00007f83eb839800 nid=0×5303 runnable [0x0000000000000000]
- java.lang.Thread.State: RUNNABLE
- Locked ownable synchronizers:
- - None
- “C2 CompilerThread1″ daemon prio=5 tid=0x00007f83ee002000 nid=0×5103 waiting on condition [0x0000000000000000]
- java.lang.Thread.State: RUNNABLE
- Locked ownable synchronizers:
- - None
- “C2 CompilerThread0″ daemon prio=5 tid=0x00007f83ee000000 nid=0x4f03 waiting on condition [0x0000000000000000]
- java.lang.Thread.State: RUNNABLE
- Locked ownable synchronizers:
- - None
- “Signal Dispatcher” daemon prio=5 tid=0x00007f83ec04c800 nid=0x4d03 runnable [0x0000000000000000]
- java.lang.Thread.State: RUNNABLE
- Locked ownable synchronizers:
- - None
- “Finalizer” daemon prio=5 tid=0x00007f83eb836800 nid=0×3903 in Object.wait() [0x000000011bc58000]
- java.lang.Thread.State: WAITING (on object monitor)
- at java.lang.Object.wait(Native Method)
- - waiting on <0x00000007aaa85608> (a java.lang.ref.ReferenceQueue$Lock)
- at java.lang.ref.ReferenceQueue.remove(ReferenceQueue.java:135)
- - locked <0x00000007aaa85608> (a java.lang.ref.ReferenceQueue$Lock)
- at java.lang.ref.ReferenceQueue.remove(ReferenceQueue.java:151)
- at java.lang.ref.Finalizer$FinalizerThread.run(Finalizer.java:209)
- Locked ownable synchronizers:
- - None
- “Reference Handler” daemon prio=5 tid=0x00007f83eb01a800 nid=0×3703 in Object.wait() [0x000000011bb55000]
- java.lang.Thread.State: WAITING (on object monitor)
- at java.lang.Object.wait(Native Method)
- - waiting on <0x00000007aaa85190> (a java.lang.ref.Reference$Lock)
- at java.lang.Object.wait(Object.java:503)
- at java.lang.ref.Reference$ReferenceHandler.run(Reference.java:133)
- - locked <0x00000007aaa85190> (a java.lang.ref.Reference$Lock)
- Locked ownable synchronizers:
- - None
- “VM Thread” prio=5 tid=0x00007f83ed808800 nid=0×3503 runnable
- “GC task thread#0 (ParallelGC)” prio=5 tid=0x00007f83ec80d800 nid=0×2503 runnable
- “GC task thread#1 (ParallelGC)” prio=5 tid=0x00007f83ec80e000 nid=0×2703 runnable
- “GC task thread#2 (ParallelGC)” prio=5 tid=0x00007f83ec001000 nid=0×2903 runnable
- “GC task thread#3 (ParallelGC)” prio=5 tid=0x00007f83ec002000 nid=0x2b03 runnable
- “GC task thread#4 (ParallelGC)” prio=5 tid=0x00007f83ec002800 nid=0x2d03 runnable
- “GC task thread#5 (ParallelGC)” prio=5 tid=0x00007f83ec003000 nid=0x2f03 runnable
- “GC task thread#6 (ParallelGC)” prio=5 tid=0x00007f83ec003800 nid=0×3103 runnable
- “GC task thread#7 (ParallelGC)” prio=5 tid=0x00007f83ec004800 nid=0×3303 runnable
- “VM Periodic Task Thread” prio=5 tid=0x00007f83ec814800 nid=0×5503 waiting on condition
- JNI global references: 134
4)从红色高亮部分可看出,代码中的30行出问题了,即往hashmap中写入数据出问题了:
- results.put(i, i);
很快就明白因为Hashmap不是线程安全的,所以问题就出在这个地方,我们可以使用线程安全的map即
ConcurrentHashMap后者HashTable来解决该问题:
- import java.util.Map;
- import java.util.concurrent.Callable;
- import java.util.concurrent.ConcurrentHashMap;
- import java.util.concurrent.ExecutionException;
- import java.util.concurrent.ExecutorService;
- import java.util.concurrent.Executors;
- /**
- *
- */
- /**
- * @author Josh Wang(Sheng)
- *
- * @email josh_wang23@hotmail.com
- */
- public class HashMapDead2LiveLock implements Callable<Integer> {
- private static ExecutorService threadPool = Executors.newFixedThreadPool(10);
- private static Map<Integer, Integer> results = new ConcurrentHashMap<>();
- @Override
- public Integer call() throws Exception {
- results.put(1, 1);
- results.put(2, 2);
- results.put(3, 3);
- for (int i = 0; i < 1000; i++) {
- results.put(i, i);
- }
- Thread.sleep(1000);
- for (int i= 0; i < 1000; i++) {
- results.remove(i);
- }
- System.out.println(“ —- ” + Thread.currentThread().getName() + ” ” + results.get(0));
- return results.get(1);
- }
- public static void main(String[] args) throws InterruptedException, ExecutionException {
- try {
- for (int i = 0; i < 2000; i++) {
- HashMapDead2LiveLock hashMapDeadLock = new HashMapDead2LiveLock();
- // Future<Integer> future = threadPool.submit(hashMapDeadLock);
- // future.get();
- threadPool.submit(hashMapDeadLock);
- }
- } catch (Exception e) {
- e.printStackTrace();
- } finally {
- threadPool.shutdown();
- }
- }
- }
改成ConcurrentHashMap后,重新执行该程序,你会发现很快该程序就执行完了。